Have you ever experienced this Salesforce scenario? Your Batch Apex job marks itself as “Completed,” yet you discover thousands of records that were never touched by your business logic. You check debug logs for the execute() methods and find nothing for those records. Yet, oddly, the finish() method seems aware of the total scope.
Welcome to the nuances of Batch Apex Transaction Isolation.
This post solves the mystery of why your finish() method can query data from the original start() scope that individual execute() methods never successfully processed.
The High-Level: It’s About Boundaries
In Salesforce Batch Apex, the finish() method executes in a completely separate transaction after all batches have completed (or failed).
Because of transaction isolation, each execute() chunk runs independently. If a chunk fails due to governor limits or unhandled exceptions, that entire chunk rolls back silently. The records in that chunk are never committed to the database in their processed state.
However, finish() gets the “30,000-foot view” post-completion. It can see the final state of the database (where those records still look unprocessed) and query the job metrics to see exactly what went wrong.
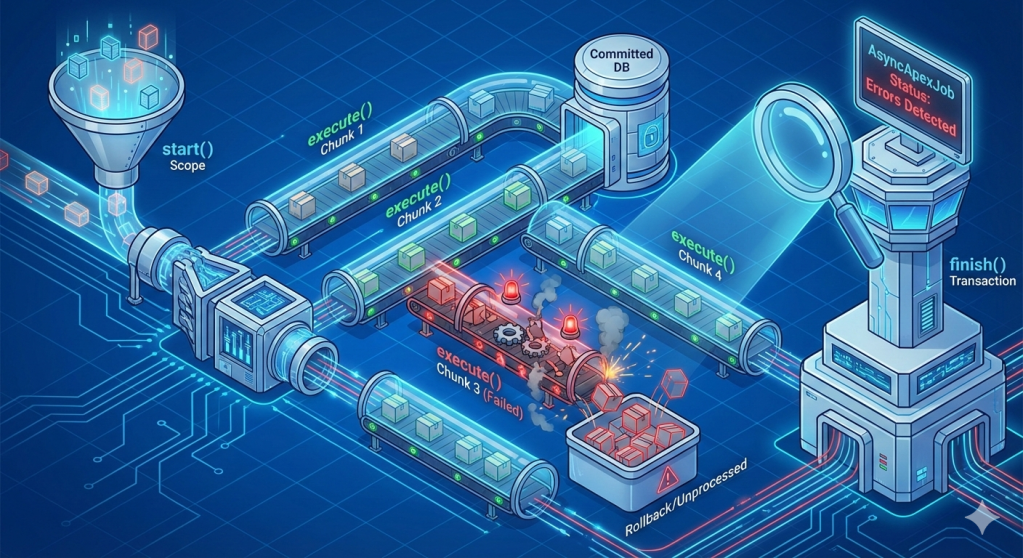
Visualizing the Disconnect
Here is the flow of a batch job. Notice how the execute() chunks are isolated lanes, while finish() is a separate checkpoint at the end.
Detailed Breakdown: Transaction Isolation
Batch Apex processes records in rigid, isolated transactions. Each execute() handles its scope (e.g., 200 records) with its own brand new set of governor limits.
If Chunk 3 hits a CPU timeout or a “Too many SOQL queries” error:
- The execution stops immediately.
- All DML operations within that specific chunk transaction are rolled back.
- Crucially: The job does not abort. It moves on to Chunk 4.
The records in Chunk 3 remain untouched in the database.
When the finish() method finally runs in its own isolated transaction, it accesses two key things:
- Full Job Metrics: By querying
AsyncApexJob, it sees the reality of the failures. - Database State: It sees the database exactly as it is. Since Chunk 3 rolled back, re-querying the original criteria reveals records that still match the “unprocessed” criteria.
Example Scenario: You have 1,000 records split into 5 chunks of 200. Chunk 3 fails on a governor limit.
execute()view: It never finished processing those 200 records.finish()view (via AsyncApexJob):TotalJobItems: 5,NumberOfErrors: 1,ExtendedStatus: "System.LimitException: Too many SOQL queries: 101"
The Code That Reveals the Discrepancy
Use your finish() method to act as the source of truth by querying the job status directly.
global void finish(Database.BatchableContext bc) { // 1. Query the AsyncApexJob to get the true execution metrics AsyncApexJob job = [SELECT Id, Status, NumberOfErrors, TotalJobItems, CompletedDate, ExtendedStatus FROM AsyncApexJob WHERE Id = :bc.getJobId()]; System.debug('Job finished. Total Batches: ' + job.TotalJobItems); System.debug('Batches with Errors: ' + job.NumberOfErrors); if (job.NumberOfErrors > 0) { // ExtendedStatus often contains the specific limit exception message System.debug('Failure Reason (ExtendedStatus): ' + job.ExtendedStatus); // Optional: Re-run the original start query to identify exactly which // records remain unprocessed in the database. // List<Account> unprocessed = Database.query(yourOriginalSOQLString); // System.debug(unprocessed.size() + ' records remain unprocessed in DB.'); }}